
In the iconic Austin Powers movie, the villainous Dr. Evil, freshly thawed from his 1967 cryogenic freeze in 1997, attempts to hold the world ransom for… one million dollars. His bewildered Number 2 rightly points out, “Don’t you think we should maybe ask for more than a million dollars? A million dollars isn’t exactly a lot of money these days.” This comedic scene perfectly sets the stage for a fascinating exploration of exponential growth and the eroding power of inflation, making it an engaging lesson for understanding the time value of money. How much should Doctor Evil have demanded in 1997, considering his outdated one million dollars request from 1967? Let’s delve into the challenges and calculations behind this million-dollar misunderstanding.
The Challenge: More Than Just One Million Dollars
Dr. Evil’s underestimation sparks several intriguing questions, perfect for classroom discussions and mathematical explorations:
- How much money should Dr. Evil realistically demand in 1997 to have the same purchasing power as one million dollars in 1967?
- What inflation rate would be necessary for one million dollars in 1967 to actually be equivalent to one hundred billion dollars in 1997, the amount Number 2 jokingly suggests?
- Considering typical inflation rates, when would demanding one hundred billion dollars become comparable to demanding one million dollars back in 1967?
These questions move beyond simple calculations and encourage a deeper understanding of economic principles and the power of exponential growth in eroding (or increasing) the value of currency over time.
Guiding Questions to Unravel the Problem
To guide students (or anyone curious about this scenario) through problem-solving, consider these questions:
- What’s an obviously too low guess for Dr. Evil’s demand?
- What’s a guess that’s likely too high?
- What’s your best initial estimate for a reasonable demand?
- Why did Doctor Evil think one million dollars was a significant sum originally?
- Why is his demand so far off from what we might expect in 1997?
Understanding the context is crucial. Remind learners that Dr. Evil is operating with a 1967 mindset in a 1997 world. His frame of reference is decades out of date, especially when it comes to the impact of inflation.
Inflation: The Silent Thief of Value
Students might initially suggest arbitrary figures, perhaps even Number 2’s humorous suggestion of nine billion dollars (based on their company’s annual earnings). However, the core issue isn’t just about pulling a larger number out of thin air; it’s about understanding inflation. Inflation is the rate at which the general level of prices for goods and services is rising, and consequently, the purchasing power of currency is falling.
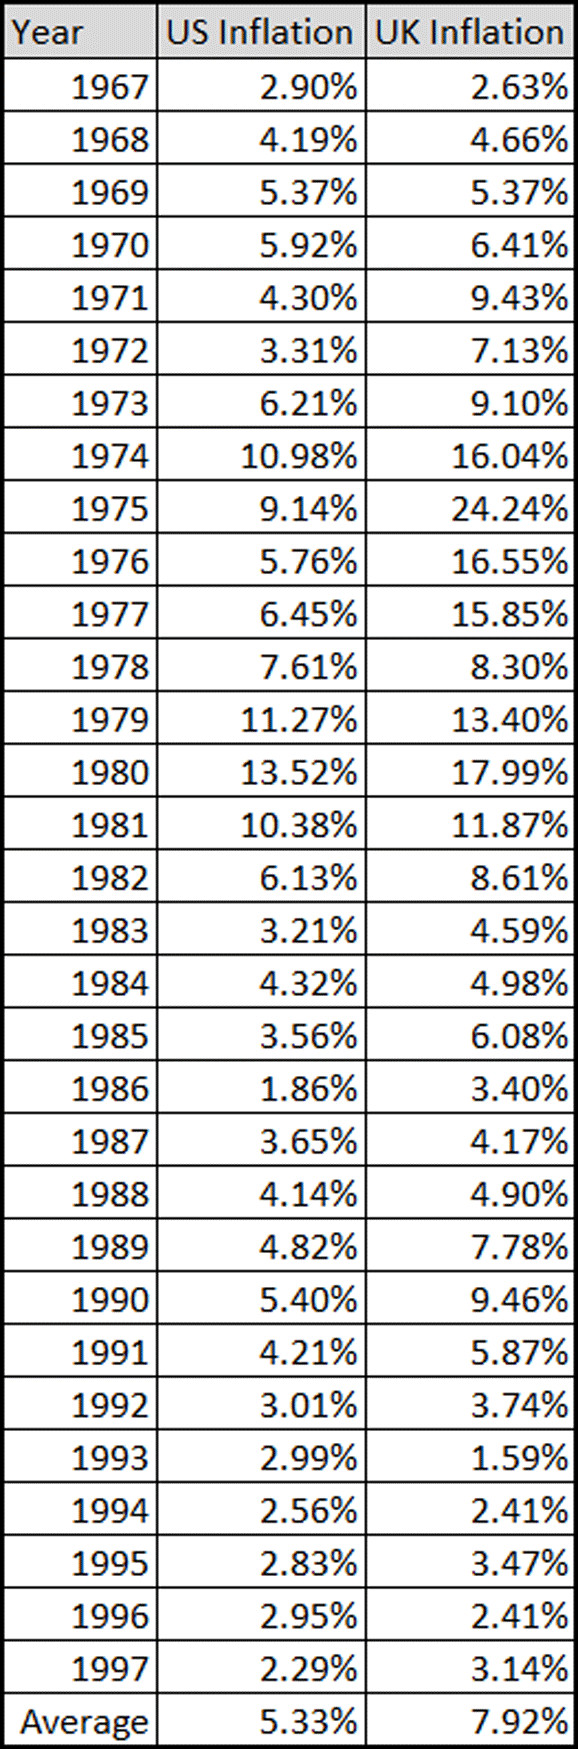
To illustrate this, let’s look at historical inflation data. The following chart presents average annual inflation rates for the United States and the United Kingdom – relevant as Dr. Evil and Austin Powers are British, but they discuss ransom in US dollars.
 average inflation rates
From 1967 to 1997, the period of Dr. Evil’s cryogenic slumber, inflation fluctuated significantly. In the US, it ranged from a low of 1.86% to a high of 13.52%. The UK saw even wider swings, from 1.59% to a staggering 24.24%. The average annual inflation during this period was approximately 5.33% in the US and 7.92% in the UK. It’s important to discuss with students which inflation rate is most relevant to Dr. Evil’s situation – a point of debate in itself!
The impact of different inflation rates on the real value of Doctor Evil’s one million dollars is dramatic. Consider these examples:
 inflation charts
These examples highlight how drastically different inflation rates can alter the perceived value of money over time.
Beyond Simple Interest: Embracing Compound Interest
Instead of immediately presenting the compound interest formula, build conceptual understanding from simpler concepts, like simple interest often taught in earlier grades. Many might know the formula for compound interest but lack a fundamental grasp of its derivation.
Encourage students to create a table demonstrating the year-by-year erosion of purchasing power due to inflation. For instance, using a 7.92% UK average inflation rate, they can calculate the value of $1 million each year. This repeated calculation, multiplying the previous year’s inflated value by 107.92% (100% principal + 7.92% inflation), visually represents compound interest in action. This process aids in understanding how geometric sequences are formed and modeled, aligning with mathematical standards related to recursive and explicit formulas for geometric sequences.
 compound conceptual chart
This hands-on approach helps students derive the compound interest formula organically, understanding its components and application rather than just memorizing it.
Challenge 1: Revising Dr. Evil’s Demand
After initial estimations and understanding inflation, show the famous Dr. Evil clip where he demands one million dollars.
[Insert Dr. Evil Clip Here – Although I cannot directly insert a video, this is where a link to the Austin Powers clip would be highly effective]
Discuss how students’ estimations compare to Dr. Evil’s outdated demand. Then, present the challenge: Using the concept of compound interest and various inflation rates, calculate a more realistic ransom demand for Dr. Evil in 1997, reflecting the 1967 value of one million dollars.
Challenge 2: The Inflation Rate to Reach $100 Billion
Now, tackle the question of the humorous $100 billion suggestion. What inflation rate would have to occur over 30 years for one million dollars in 1967 to become equivalent to $100 billion in 1997? This requires setting up and solving an equation:
$100,000,000,000 = $1,000,000 * (x)^30
Where:
- $100 billion is the target equivalent value.
- $1 million is the initial amount.
- x is the unknown inflation rate factor (1 + inflation rate as a decimal).
- 30 is the number of years (1997 – 1967).
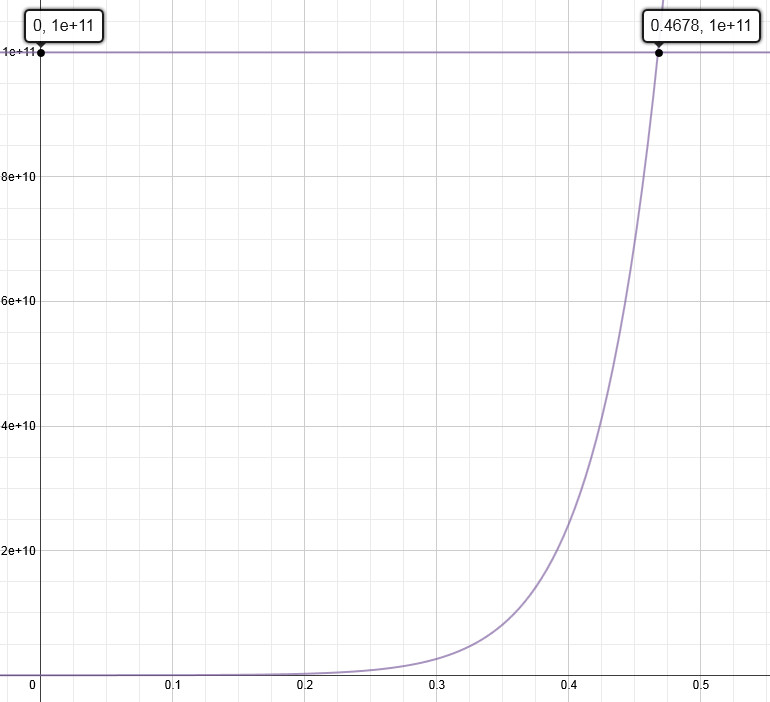
Solving for x reveals that an astounding ~46.78% annual inflation rate would be needed! Visualize this solution using a graphing calculator like Desmos:
 challenge 2 desmos graph
This visually demonstrates the extreme inflation rate needed to justify such a massive increase in value over just three decades.
Challenge 3: Time to $100 Billion at Realistic Inflation
Finally, shift the challenge again. Instead of manipulating the inflation rate, fix it at a more realistic average (e.g., 7.92% UK average) and ask: How many years would it take for one million dollars in 1967 to reach the purchasing power of $100 billion, assuming this 7.92% annual inflation rate? The equation becomes:
$100,000,000,000 = $1,000,000 * (1 + 0.0792)^x
Where:
- $100 billion is the target equivalent value.
- $1 million is the initial amount.
- 0.0792 represents the 7.92% inflation rate.
- x is the unknown number of years.
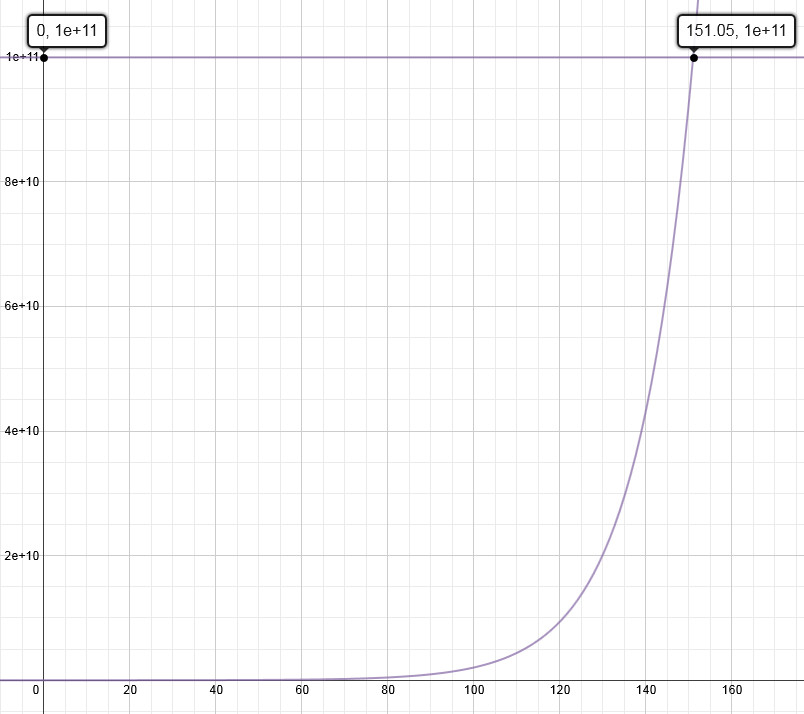
Solving for x, we find it would take approximately 151 years! This means that by the year 2118, one million dollars in 1967 would have roughly the same buying power as $100 billion in 1997, assuming a consistent 7.92% inflation rate. Visualize this long timeframe with Desmos:
 challenge 3 desmos graph
This result dramatically illustrates how Dr. Evil’s jump to $100 billion was wildly exaggerated in the short term, but potentially achievable over a very long period due to the power of compounding inflation.
Integrating into the Curriculum
This “Doctor Evil” scenario provides a memorable and humorous context for teaching crucial mathematical and economic concepts. Resources like Yummymath and Desmos offer interactive graphs and activities to further enhance this lesson. It directly connects to curriculum standards involving exponential functions, compound interest, and the real-world application of mathematical modeling in understanding financial concepts like inflation and the time value of money.
By using pop culture to explore the seemingly simple question of Doctor Evil’s one million dollars, educators can create engaging lessons that make abstract economic principles relatable and understandable for learners of all ages.